Traces and logs for local development and docker
How I organize my utility services, like log and trace collection, for modularity and reusability during local development


During local development it is super helpful to know what your applications are doing. The two main ways to get that information are logs and traces. I’m ignoring metrics, and actual debugging tools for this article, and focus on how to collect both in a way that’s useful for what you want to do, and flexible so you can focus on writing your services.
TL;DR: repository for the util docker compose: https://github.com/javorszky/localdev-util
Logs
Here are the problems that I set out to solve:
- logs need to be searchable
- they should have structure added to it, so I don’t need to search using freeform text
- I don’t want to use the terminal to search through them
- nor do I want to view a file, or several files
- locally usable
Producing logs
Different programming languages and libraries have different ways of creating log entries. In Golang, my bread and butter of a language, logs are usually printed to os.Stdout or os.Stderr, which usually ends up being the terminal of the running application.
Within a docker container, the logs will appear in the output of the container itself.
For languages that are request/response based, like PHP, logging to stdout is kinda weird, but still doable. In PHP land, you should be using the monolog library anyhow, in which case there are two ways to format the messages:
- either pipe them to stdout / stderr using the stream handlers, or
- directly send the logs to a GELF server, which will make sense in a moment
Handling logs
There are cloud solutions for this already, like Papertrail and Loggly, but you need internet connection and some sort of a payment method to use them. They’re also not locally deployed.
My tool of choice here is a local image of seq: https://datalust.co/. It can ingest logs in various different formats. I use GELF, which needs a sidecar, or a companion image. Everything that can produce logs can produce them in GELF format, so this works incredibly well for my use case.
Traces
Opentelemetry!
To aid interoperability and the ability to swap bits and pieces out for other things, I very much recommend using the opentelemetry collector agent. I usually put this in a separate docker service in the same docker compose file of whatever service I’m building, and configure the trace exporter library – also from opentelemetry – to send traces to someplace.
I’m ignoring collecting logs with opentelemetry for the moment. It can absolutely be done, but requires a lot more setup.
Putting them together
With that said, here’s how I structured my log and trace collection. There’s a utility docker compose that I start up that’s separate from my project docker compose. The neat thing is that once I configured this, I can set up however many projects and tell them to send logs and traces here, and it just works. No need to install anything on the host computer, because all of this runs inside docker.
version: "3.9"
services:
  sqelf:
    image: datalust/seq-input-gelf:latest
    container_name: util_sqelf
    depends_on:
      - seq
    ports:
      - "12201:12201/udp"
    environment:
      SEQ_ADDRESS: "http://seq:5341"
    restart: unless-stopped

  seq:
    image: datalust/seq:latest
    container_name: util_seq
    restart: unless-stopped
    environment:
      ACCEPT_EULA: y
      # to get the password hash, run this:
      # echo '<password>' | docker run --rm -i datalust/seq config hash
      SEQ_FIRSTRUN_ADMINPASSWORDHASH: "${SEQ_PH}"
    ports:
      - "8089:80" # reach the UI on localhost:8090
      - "6665:5341" # ingest port is 6665 from outside of docker compose, 5341 from inside of docker compose
    volumes:
      - ./data/seq:/data

  tempo:
    image: grafana/tempo:latest
    container_name: util_tempo
    logging:
      driver: gelf
      options:
        gelf-address: "udp://host.docker.internal:12201"
        tag: tempo
        mode: non-blocking
    command: [ "-config.file=/etc/tempo.yaml" ]
    volumes:
      - ./data/tempo/config/config.tempo.yaml:/etc/tempo.yaml
      - ./data/tempo/data:/tmp/tempo
    ports:
      - "6666:4317"  # otlp grpc
      - "3999"   # tempo

  grafana:
    depends_on:
      - tempo
    image: grafana/grafana-oss
    logging:
      driver: gelf
      options:
        gelf-address: "udp://host.docker.internal:12201"
        tag: grafana
        mode: non-blocking
    container_name: util_grafana
    restart: unless-stopped
    ports:
      - '3998:3000'
    volumes:
      - ./data/grafana/data:/var/lib/grafana

  athens:
    platform: linux/amd64
    image: gomods/athens:v0.12.0
    container_name: util_athens
    logging:
      driver: gelf
      options:
        gelf-address: "udp://host.docker.internal:12201"
        tag: athens
        mode: non-blocking
    ports:
      - "1337:3000"
    restart: always
    environment:
      ATHENS_DISK_STORAGE_ROOT: /var/lib/athens
      ATHENS_STORAGE_TYPE: disk
    volumes:
      - ./data/athens:/var/lib/athens
All of them are configured for very specific reasons.
Utility services
sqelf
This is the sidecar that takes GELF formatted logs from all round different places, reformats them, I suppose, and then sends them along to the seq service where you can actually look at them.
Open port is 12201, and the scheme is udp instead of http, which is important. Also note that this is only a good idea if everything is local, because you dont’t want unsecured data traversing the public interent.
seq
Takes data mostly from the sqelf service within the docker compose, which is why the target is configured to be http://seq:5341. Technically seq can also be reached from the host computer for data ingest, but it’s not used directly.
The ingest and UI ports are separated, to not mix traffic. Once the service is up and running, you can access it on http://localhost:8089.
These two take care of logs. I’ll add how to send logs here in just a moment.
Before running the container, you do need to create an environment variable named SEQ_PH that stores a password hash. To get the value, use the command in the docker compose service definition.
tempo
It’s a grafana product, essentially takes trace data, which we can then visualize with grafana. It’s a database.
There are two open ports to the host computer: 6666 and 3999. You will use port 6666 to send data there, and port 3999 to query data.
grafana
Pretty UI used for the sole purpose of looking at traces from tempo. Once this is running, you need to add a data source, choose Tempo, and the host should be http://tempo:3999. They run in the same docker compose, they have access to each other by their service names.
athens
That’s a Golang module proxy. Does not play any part in traces and logs, so I’ll ignore it.
Service configurations
You might have noticed that some of the services have a logging directive attached to the service described in the docker compose. An example is this:
logging:
  driver: gelf
  options:
    gelf-address: "udp://host.docker.internal:12201"
    tag: grafana
    mode: non-blocking
This tells the docker runtime to catch all the logs from the service, format them in gelf format, send them to the address specified, add a custom tag with whatever I wrote there, and do it in a non blocking way.
You might be asking why I’m using the host.docker.internal address instead of the sqelf one, which is where the service is that takes these logs.
Turns out that the docker runtime that deals with logging is not part of the network of the docker compose that it’s extracting logs from, which means the internal DNS lookup for where the service sqelf is will never succeed. Instead it goes outside of the docker compose, into the host system, and then accesses whatever service is running on port 12201 on the host. It’s essentially as if you opened your broswer and typed in localhost:12201 into the address bar, except in this case it’s over udp, and not http.
Luckily the sqelf service has that port open, so this can work. For more background, see this comment on the seq-gelf repository: https://github.com/datalust/seq-input-gelf/issues/77#issuecomment-670255253.
This also means that when I’m working on whatever service, it will be in a different docker compose altogether.
Their docker logging directive will look much the same, with the only difference being the tag. That way any logs that are printed to the stdout and stderr of the individual services will have that tag attached to it, so you can easily filter by service.
The other is that when you’re configuring the trace exporter in your application, the grpc endpoint should be http://host.docker.internal:6666, which is the utility docker compose’s tempo service’s open port that can be accessed from the host system.
The traces will then hop out from within the docker compose network into the host system network, and from there into the tempo service within the utility compose.
For logs you can either print them out to the docker container’s stdout and stderr, or if you want to directly send logs to the sqelf service, use the gelf format, and target host.docker.internal:12201.
Results
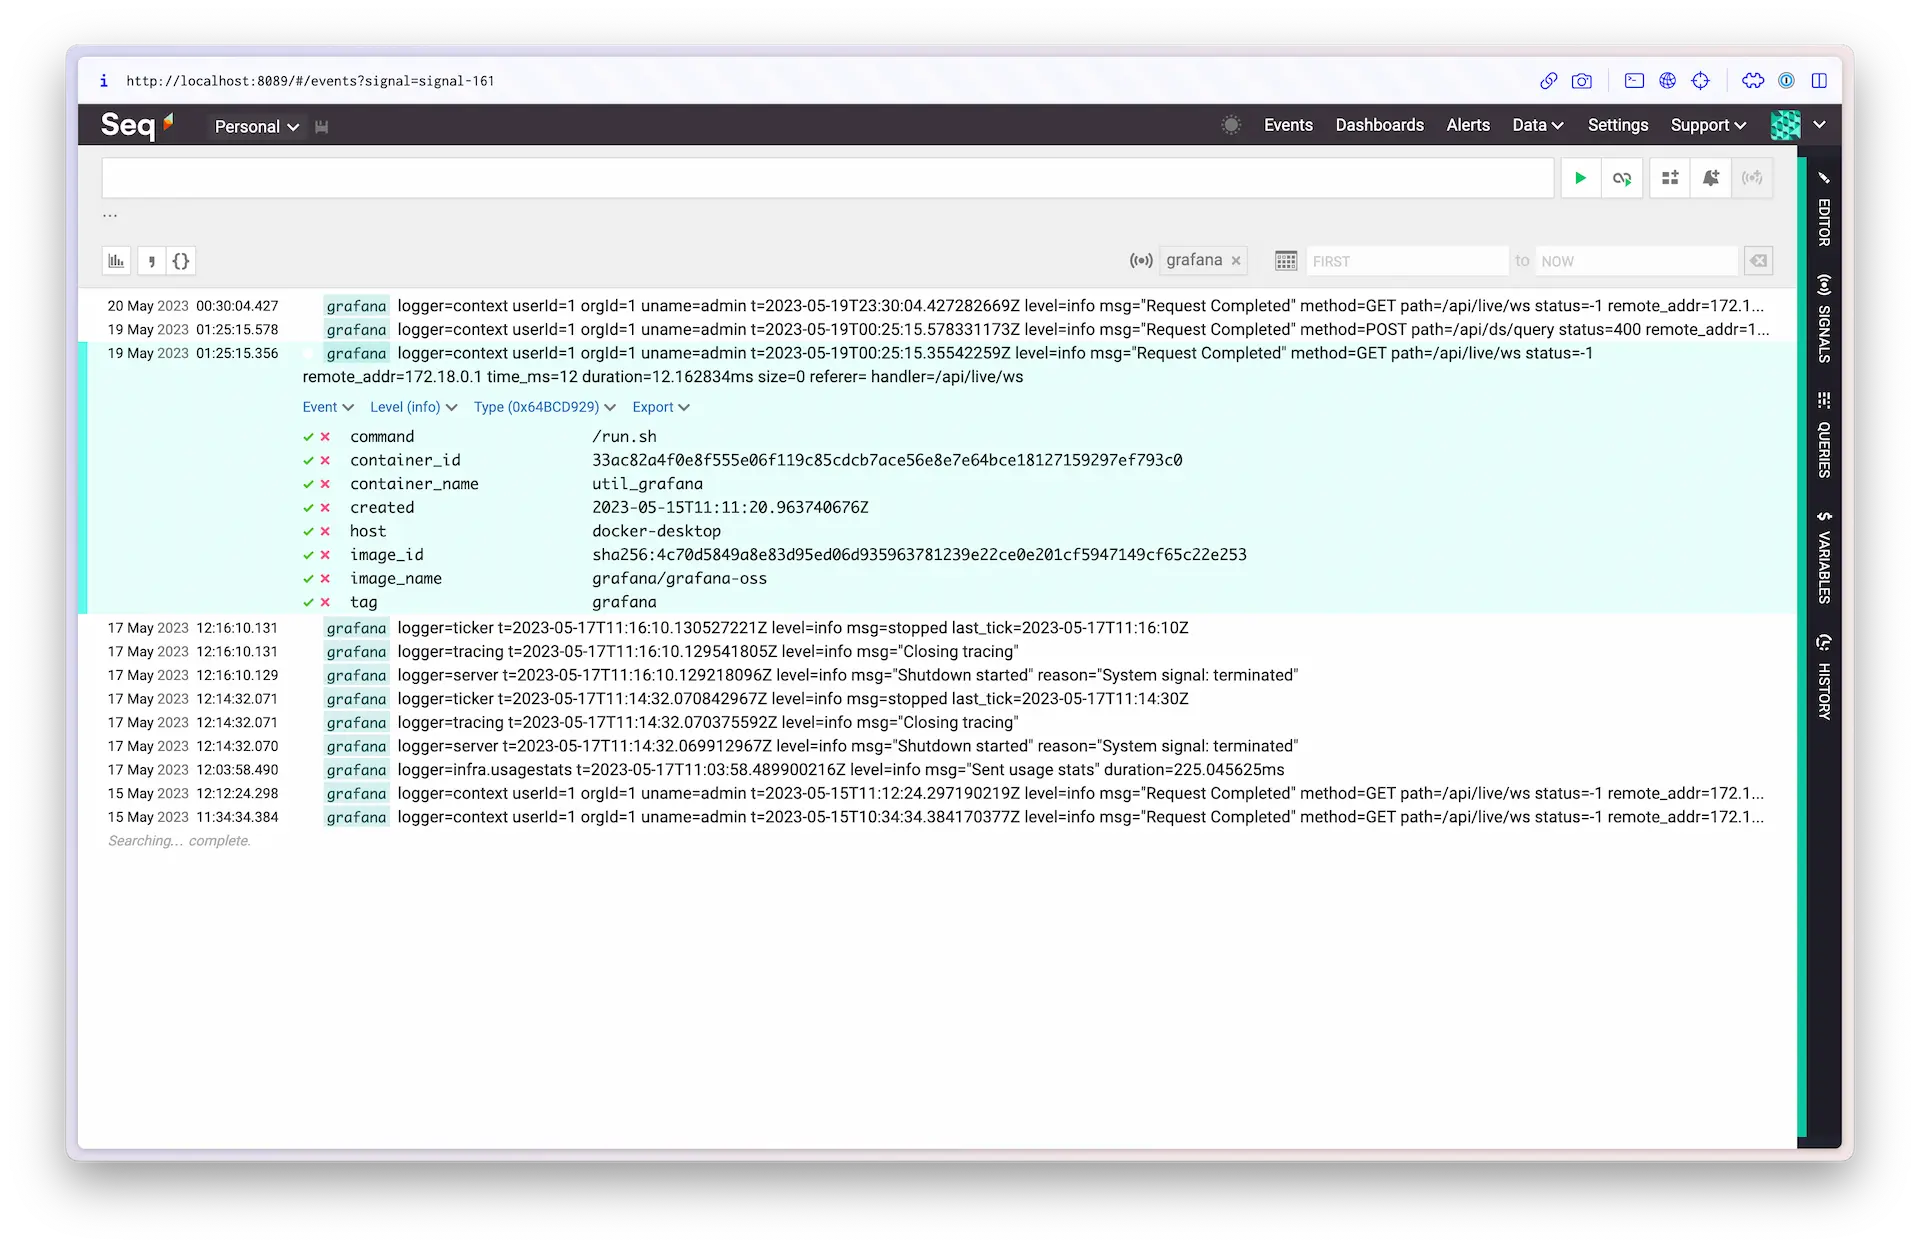
Here’s what logs in seq this looks like on my end
And this is tracing with all service specific information removed:
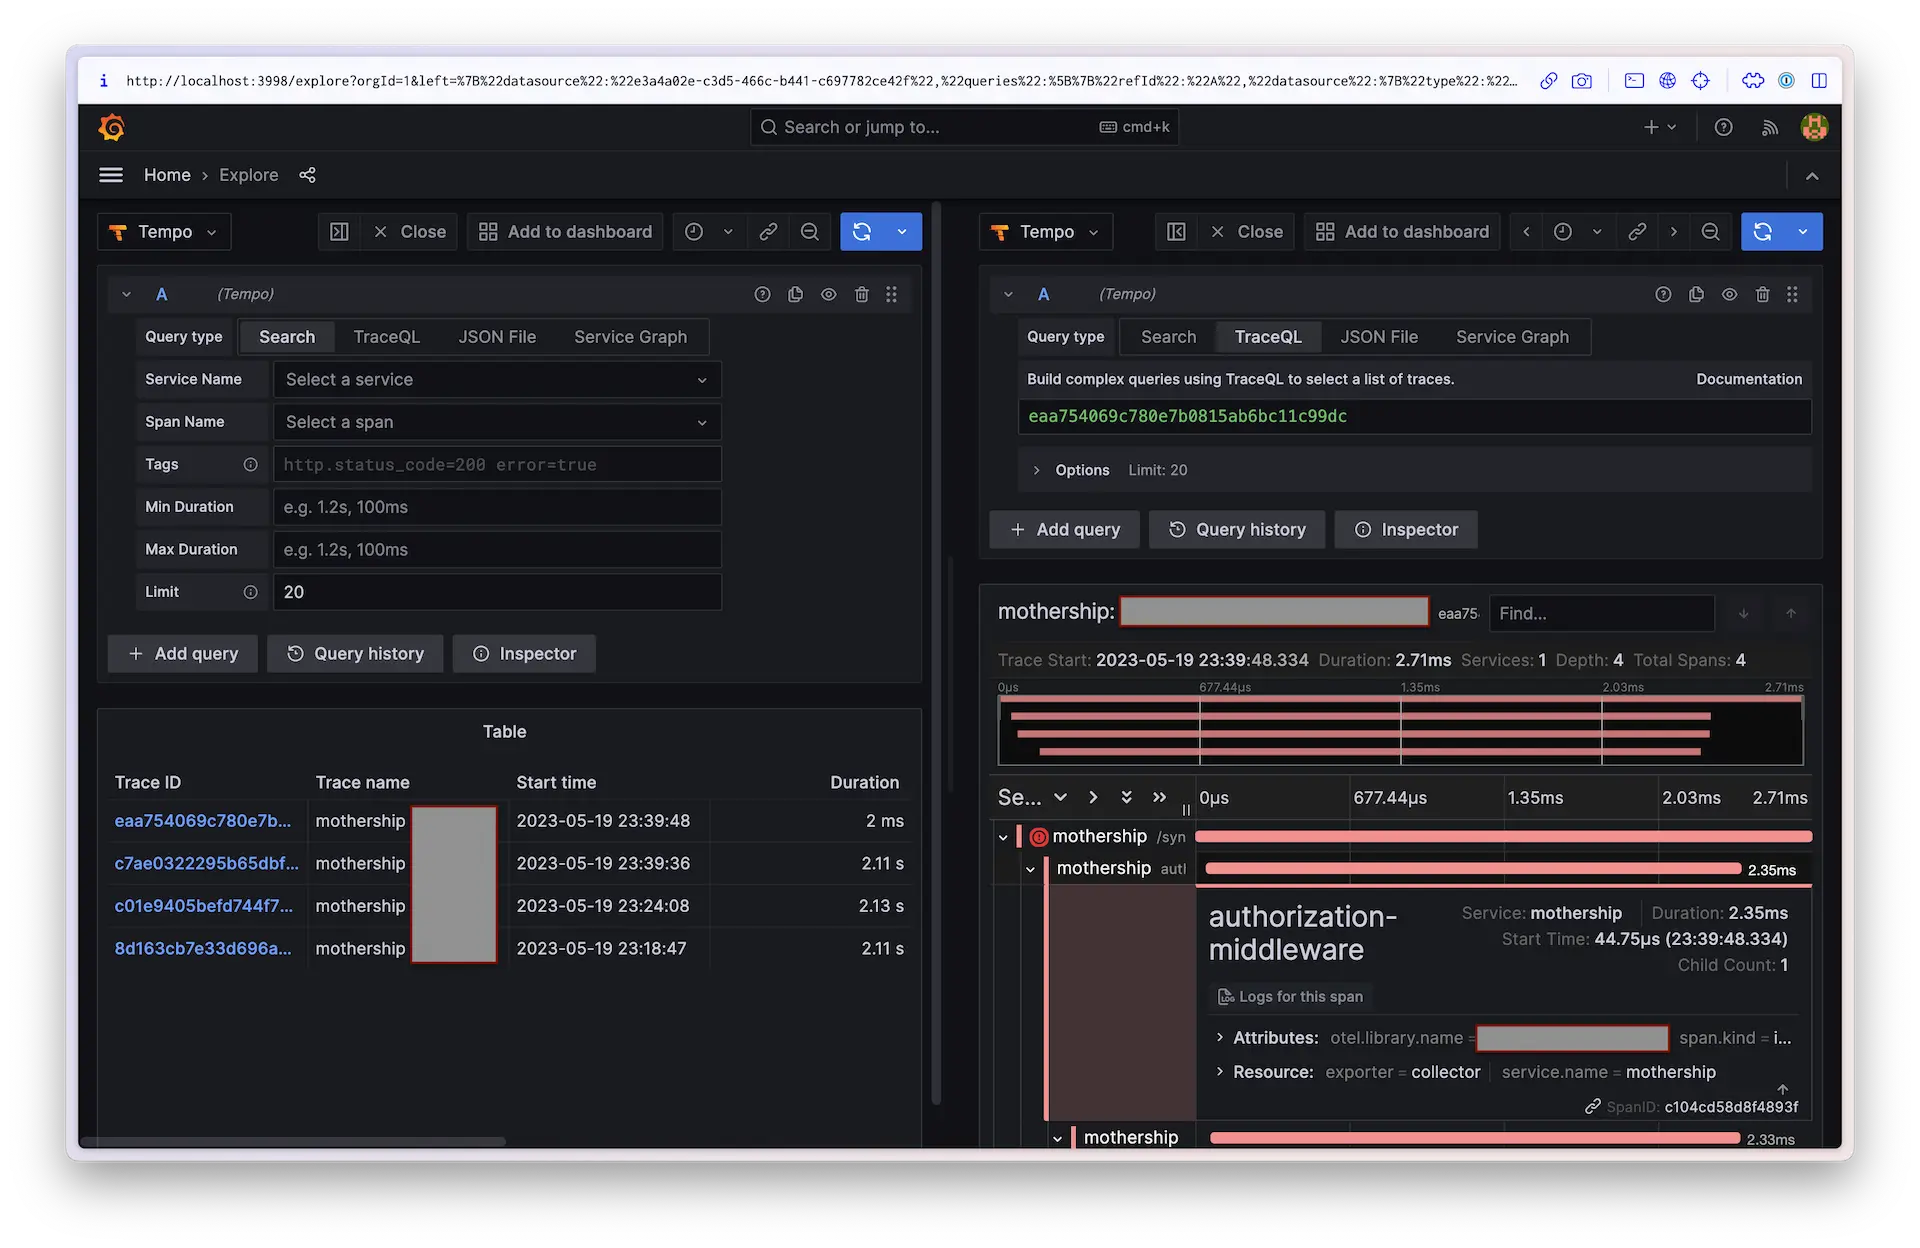
There are a lot more nuance here, however I think this should be enough to show what I’m doing and why. If you do have questions, you can reach me on mastodon at @javorszky@notacult.social, and on bluesky at @javorszky.rocks.
Credits
- Cover photo by Philip Brown on Unsplash
- Logs heading background photo by Mildly Useful on Unsplash
- Traces heading background photo by Caterina Beleffi on Unsplash
- Putting them together background photo by Vardan Papikyan on Unsplash
- Results heading background photo by Luke Chesser on Unsplash